Creating Awesome Charts with Ease
Ever tried making a chart with traditional charting tools? The frustration is real. From deciphering complicated documentation to wrestling with code snippets, it's like trying to solve a Rubik's Cube while blindfolded. But fear not, fellow chart enthusiasts!
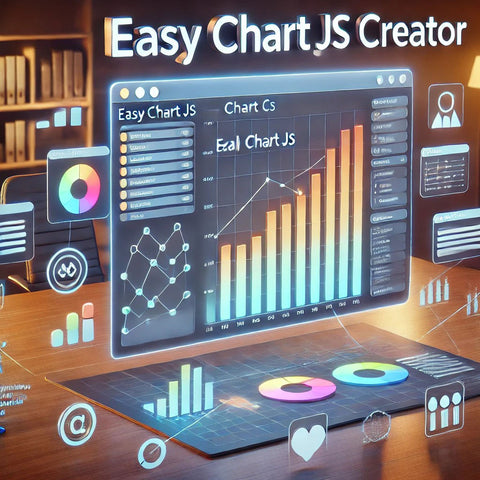
Introducing the Chart.js Easy Creator. This tool is like a soothing balm for all your charting woes. Whether you're a data wizard or just dipping your toes into the charting world, this tool has your back.
The Chart.js Phenomenon
If Chart.js were a superhero, it would be Captain Chart, saving the day with stunning visuals and intuitive features. Chart.js is a widely adopted JavaScript library that empowers developers and non-developers alike to create beautiful charts without the headache.
From line graphs that dance like an interpretive dancer to pie charts that are more satisfying than a slice of pizza, Chart.js offers a range of chart types to suit your data storytelling needs.
Why Choose Chart.js?
Why settle for mediocre when you can have marvelous? Chart.js is superior to other charting tools for many reasons:
- 🚀 Simplicity: No more deciphering hieroglyphics-like documentation. Chart.js speaks human and lets you create charts with minimal effort.
- 🎨 Customization: Tired of charts that look like they belong in the '90s? Chart.js lets you customize colors, fonts, and more to match your brand's style.
- 🌐 Wide Adoption: Chart.js is the cool kid on the block, with a massive community and tons of resources to help you along the way.
Bars for Days
Now that you've got the Chart.js Easy Creator in your toolbelt, the possibilities are endless. You might be wondering, "What can I use bar graphs for?" Here are a few suggestions:
- 📊 Business Analytics: Visualize your sales, growth, and customer data to make informed decisions.
- 🗓️ Project Timelines: Showcase project milestones and timelines in a visually engaging way.
- 📈 Comparative Data: Compare data points, like product sales or survey responses, side by side.
- 📚 Educational Tools: Create interactive educational content with visual aids.
With the Chart.js Easy Creator, you're not just making charts. You're making magic. Say goodbye to frustration and hello to charting bliss!
So go ahead, give it a try. We dare you not to be amazed by how easy and awesome your chart-making experience can be. Captain Chart would be proud!


